Installation GuideGuia de Instalação
-
01
Locate MT5 Data FolderAbra a Pasta de Dados Open MetaTrader 5. Go to
File>Open Data Folder. Abra o MetaTrader 5. Vá emArquivo>Abrir Pasta de Dados. -
02
Install the AlgorithmInstale o Algoritmo Navigate to
MQL5>Experts. Paste the.ex5file you received here. Navegue atéMQL5>Experts. Cole o arquivo.ex5que você recebeu nesta pasta. -
03
Enable Auto Trading & Load SettingsAtive e Carregue o Setup Click
Algo Trading. Drag QuantumGrid Smart onto your chart (EURUSD M15 required). Go to Inputs and load the provided.setfile with optimized parameters. Clique emAlgo Trading. Arraste o QuantumGrid Smart para o gráfico (EURUSD M15 obrigatório). Vá na aba Parâmetros e carregue o arquivo.setcom os parâmetros otimizados.
💡 Recommended Setup💡 Setup Recomendado
EURUSD, M15 timeframe, any account type (hedging not required), 1:100 leverage. The included .set file contains all validated parameters from the 14-year backtest.EURUSD, timeframe M15, qualquer tipo de conta (hedging não obrigatório), alavancagem 1:100. O arquivo .set incluído contém todos os parâmetros validados do backtest de 14 anos.
⚠️ License Alert⚠️ Alerta de Licença
If you see a "License invalid for this account" alert, your copy is licensed to a different MT5 account number. Contact support via Telegram with your account number to resolve this.Se você ver um alerta "License invalid for this account", sua cópia está licenciada para outro número de conta MT5. Contate o suporte pelo Telegram informando o número da sua conta.
The DashboardO Painel
📊 Performance
Tracks Total Profit, Today's P&L, Monthly P&L, and Floating P&L. The Account Health bar monitors Equity vs Balance ratio, staying near 100% with no open cycle and reflecting the floating result while a cycle is in progress. Rastreia Lucro Total, P&L do Dia, P&L Mensal e P&L Flutuante. A barra Account Health monitora a razão Patrimônio vs Saldo, ficando perto de 100% sem ciclo aberto e refletindo o resultado flutuante durante um ciclo em andamento.
🛡️ Risk & Safety
Shows current Drawdown (color-coded as it approaches the safety limit), overall Safety status, Margin level, cumulative Lots traded, and Win rate across closed cycles. Mostra o Drawdown atual (com cor conforme se aproxima do limite de segurança), status geral de Segurança, nível de Margem, Lotes operados acumulados e Win rate dos ciclos fechados.
⚡ Quick Controls
- CLOSE ALL: Immediately closes all open positions managed by the EA. Use with care — this realizes any current floating loss.Fecha imediatamente todas as posições gerenciadas pelo EA. Use com cuidado — isso realiza qualquer perda flutuante atual.
- PAUSE / RESUME: Pauses new trading cycles while any cycle already in progress continues to be managed normally until it closes.Pausa novos ciclos de negociação enquanto qualquer ciclo já em andamento continua sendo gerenciado normalmente até fechar.
- STOP AFTER CYCLE: Arms a one-time pause — the EA finishes the current cycle as normal, then automatically switches to PAUSE the moment it closes. Useful for a clean handover before the weekend.Arma uma pausa única — o EA termina o ciclo atual normalmente e depois muda automaticamente para PAUSE assim que ele fechar. Útil para uma transição limpa antes do fim de semana.
Entry LogicLógica de Entrada
QuantumGrid Smart employs a proprietary dual-confirmation entry system. The algorithm monitors momentum exhaustion and statistical price deviation simultaneously using two independent mathematical filters. A new grid cycle is only initiated when both filters converge on a high-probability reversal zone. If price moves against the initial entry, the algorithm opens additional positions at volatility-adjusted intervals, with position sizing that adapts to current market conditions — and a dynamic profit target that adjusts to the prevailing volatility regime.
O QuantumGrid Smart utiliza um sistema proprietário de entrada com dupla confirmação. O algoritmo monitora exaustão de momento e desvio estatístico de preço simultaneamente usando dois filtros matemáticos independentes. Um novo ciclo de grid só é iniciado quando ambos os filtros convergem numa zona de reversão de alta probabilidade. Se o preço se mover contra a entrada inicial, o algoritmo abre posições adicionais em intervalos ajustados à volatilidade, com dimensionamento de posição que se adapta às condições atuais do mercado — e um alvo de lucro dinâmico que se ajusta ao regime de volatilidade predominante.
Why This MattersPor Que Isso Importa
This is our most rigorously validated engine: 14+ years of real-tick EURUSD M15 data (2012–2026), including an out-of-sample validation window separate from the optimization period. The entry system's selectivity means the grid never reached its configured maximum level across the entire 14-year test — a signal of structural robustness, not luck. Este é nosso motor mais rigorosamente validado: 14+ anos de dados reais tick-a-tick de EURUSD M15 (2012–2026), incluindo uma janela de validação out-of-sample separada do período de otimização. A seletividade do sistema de entrada significa que o grid nunca atingiu seu nível máximo configurado em todo o teste de 14 anos — um sinal de robustez estrutural, não sorte.
AI GuardianAI Guardian
QuantumGrid Smart ships with an AI-ready risk architecture — an optional neural-network risk supervisor that can monitor each open cycle and intervene to reduce exposure when it detects elevated-risk conditions. Our validated flagship configuration runs with this supervisor disabled: across extensive testing, the core mechanical engine alone consistently matched or outperformed every AI-supervised variant. Rather than ship an unproven feature, we ship the configuration with the strongest track record — the architecture remains in place, audited and ready, for future enhancement.
O QuantumGrid Smart vem com uma arquitetura de risco AI-ready — um supervisor de risco opcional baseado em rede neural que pode monitorar cada ciclo aberto e intervir para reduzir exposição quando detecta condições de risco elevado. Nossa configuração flagship validada roda com esse supervisor desativado: em testes extensivos, o motor mecânico principal sozinho igualou ou superou consistentemente cada variante supervisionada por IA. Em vez de lançar uma funcionalidade não comprovada, entregamos a configuração com o histórico mais forte — a arquitetura permanece pronta, auditada, para aprimoramento futuro.
Standby
Monitoring market conditions. No active intervention.
Monitorando condições de mercado. Sem intervenção ativa.
Recovery Boost
An exhaustion pattern detected; sizing the next recovery position more assertively.
Padrão de exaustão detectado; dimensionando a próxima posição de recuperação de forma mais assertiva.
Quick Exit
Targeting a fast exit to reduce time-in-market.
Buscando uma saída rápida para reduzir tempo em mercado.
Risk Shield
Elevated risk detected — prioritizing a safe exit over maximizing this cycle's profit.
Risco elevado detectado — priorizando uma saída segura em vez de maximizar o lucro deste ciclo.
In the validated flagship preset, the dashboard shows "Disabled" — the core strategy operates independently and does not require the supervisor. No preset flagship validado, o painel mostra "Disabled" — a estratégia principal opera de forma independente e não requer o supervisor.
Robustness AnalysisAnálise de Robustez
Beyond the single 14-year backtest run, we subject every flagship configuration to a statistical robustness screen before it ships: 2,000-iteration Monte Carlo resampling of the realized trades, plus a temporal-stability deep-dive checking whether the edge holds up across every individual year and every rolling window of the test. This is an internal robustness analysis performed with our own auditing methodology — not a third-party certification. We publish it anyway, caveats included, because a number we're willing to show you unfiltered is worth more than a number that only looks good.
Além do backtest único de 14 anos, submetemos toda configuração flagship a uma triagem estatística de robustez antes de lançar: reamostragem Monte Carlo de 2.000 iterações sobre os trades realizados, mais uma análise de estabilidade temporal verificando se o edge se sustenta em cada ano individual e em cada janela móvel do teste. Esta é uma análise interna de robustez, feita com nossa própria metodologia de auditoria — não é uma certificação de terceiros. Publicamos mesmo assim, com os alertas incluídos, porque um número que topamos mostrar sem filtro vale mais que um número que só parece bom.
VerdictVeredito
ROBUST
The realized edge holds up under randomized trade ordering. Monte Carlo drawdowns stay close to the observed run and the probability of a losing outcome across 2,000 resamples is negligible. O edge realizado se sustenta sob reordenação aleatória dos trades. Os drawdowns simulados por Monte Carlo ficam próximos do resultado observado e a probabilidade de um resultado perdedor em 2.000 reamostragens é desprezível.
$31,204
Net ProfitLucro Líquido
5.37
Profit FactorFator de Lucro
68.2%
Win RateTaxa de Acerto
11.52%
Max Equity DDMáx. DD Capital
0.0%
P(loss), MCP(perda), MC
⚠️ Read This Before the Rest⚠️ Leia Isto Antes do Resto
Max equity (floating) drawdown of 11.52% is 6.7× the max balance drawdown (1.71%). This is characteristic of grid systems: closed-trade statistics understate true capital-at-risk, because the basket can sit deep underwater between recovery levels while the closed-balance line still looks smooth. Size your capital against the equity figure, not the balance figure.
O drawdown máximo de capital (flutuante) de 11.52% é 6,7× o drawdown máximo de saldo (1,71%). Isso é característico de sistemas de grid: as estatísticas de trades fechados subestimam o capital real em risco, porque a cesta pode ficar bastante submersa entre níveis de recuperação enquanto a linha de saldo fechado ainda parece lisa. Dimensione seu capital pela figura de capital líquido (equity), não pela de saldo.
📈 Track Record (Realized)📈 Histórico Realizado
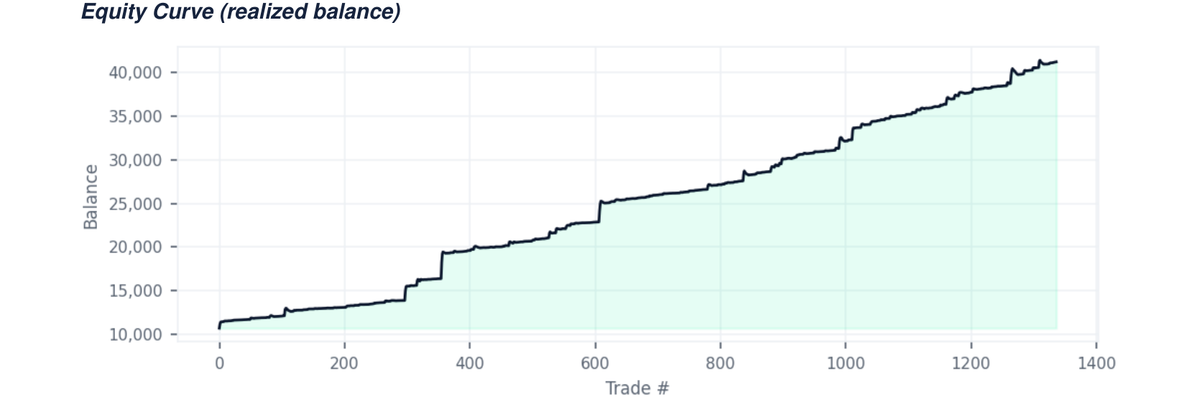
Realized account balance across the full 14-year backtest sequence.Saldo de conta realizado ao longo de toda a sequência de backtest de 14 anos.
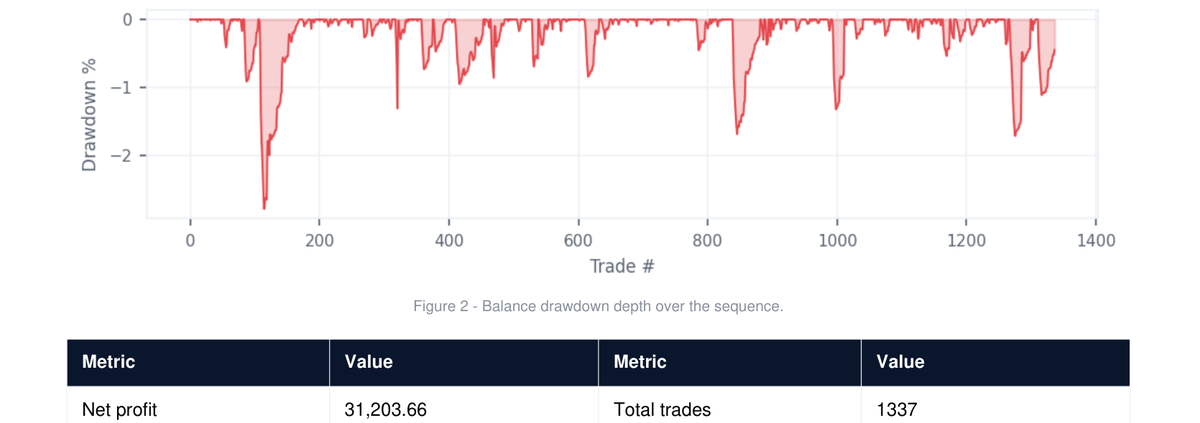
Balance drawdown depth over the trade sequence — closed-trade view only (see grid caveat above for the equity/floating figure).Profundidade do drawdown de saldo ao longo da sequência de trades — visão apenas de trades fechados (ver alerta de grid acima para a figura de capital/flutuante).
🎲 Monte Carlo Robustness (2,000 simulations)🎲 Robustez Monte Carlo (2.000 simulações)
The 1,337 realized trades are resampled with replacement 2,000 times to test whether the edge survives a different ordering and mix of the same trades — the standard screen for luck versus structural edge.
Os 1.337 trades realizados são reamostrados com reposição 2.000 vezes para testar se o edge sobrevive a uma ordem e combinação diferentes dos mesmos trades — a triagem padrão para distinguir sorte de edge estrutural.
24,928
Worst 5% NetPior 5% Líquido
30,919
Median NetMediana Líquido
2.61%
MC P95 DrawdownMC P95 Drawdown
6.14%
Worst Observed DDPior DD Observado
MC P95 drawdown (2.61%) is a more realistic worst-case figure to size against than the single-run backtest drawdown — it already accounts for a range of trade orderings, not just the one sequence that happened historically.
O drawdown MC P95 (2,61%) é uma referência de pior caso mais realista para dimensionamento do que o drawdown de uma única rodada de backtest — ele já contempla uma faixa de ordenações de trades, não só a sequência que aconteceu historicamente.
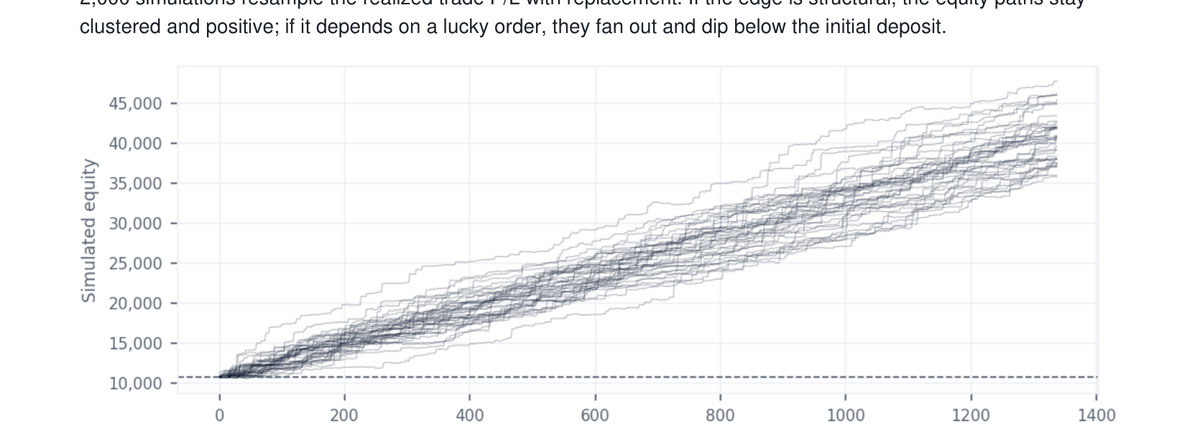
Sample of the 2,000 simulated equity paths. Dashed line = initial deposit.Amostra dos 2.000 caminhos de capital simulados. Linha tracejada = depósito inicial.
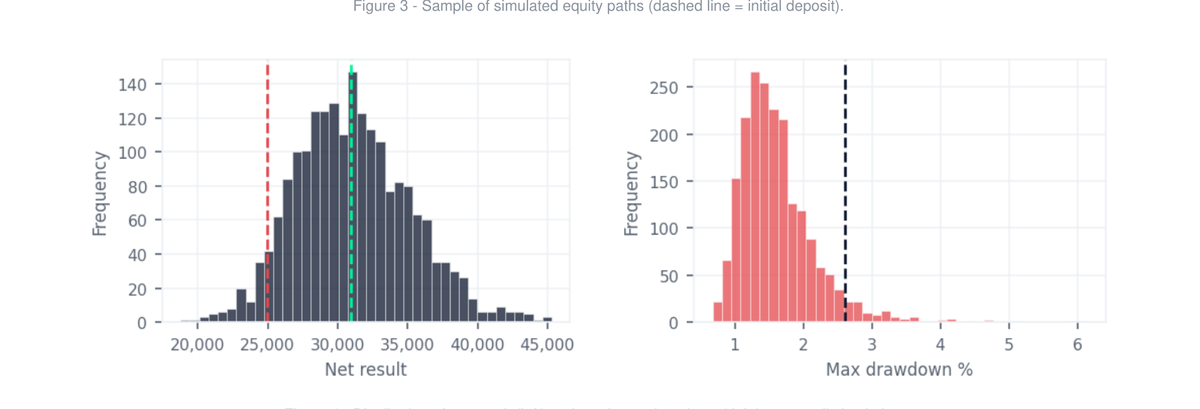
Distribution of net result (left) and maximum drawdown (right) across all 2,000 simulations.Distribuição do resultado líquido (esquerda) e drawdown máximo (direita) nas 2.000 simulações.
📅 Temporal Stability: STRONG📅 Estabilidade Temporal: FORTE
Tests whether the realized edge is stable across time — not concentrated in a few lucky years or months. This is a temporal-robustness analysis of the realized track record; it is not a walk-forward optimization, which would require the strategy source code and price data run fresh out-of-sample.
Testa se o edge realizado é estável ao longo do tempo — não concentrado em poucos anos ou meses de sorte. É uma análise de robustez temporal do track record realizado; não é uma otimização walk-forward, que exigiria o código-fonte da estratégia e dados de preço rodados do zero fora da amostra.
- ✓ 14 of 14 years profitable (2012–2025), no losing calendar year across the full test.14 de 14 anos lucrativos (2012–2025), nenhum ano-calendário perdedor em todo o teste.
- ✓ Late/early expectancy ratio = 1.00. Split chronologically in half, the second half of the track record reproduces the first — the edge shows no decay over time, a strong sign it's structural rather than a fading anomaly.Razão de expectativa tardia/inicial = 1,00. Dividido cronologicamente ao meio, a segunda metade do track record reproduz a primeira — o edge não mostra decaimento ao longo do tempo, forte sinal de que é estrutural, não uma anomalia que se esvai.
- ✓ 0 of 1,248 rolling 90-trade windows had negative risk-adjusted return. No sustained losing regime anywhere in the realized sequence.0 de 1.248 janelas móveis de 90 trades tiveram retorno ajustado ao risco negativo. Nenhum regime de perda sustentada em qualquer trecho da sequência realizada.
- ✓ Profit well distributed: best single month = 9.4% of total profit; top 5 months = 31.1%. Not dependent on a handful of outlier months.Lucro bem distribuído: melhor mês único = 9,4% do lucro total; top 5 meses = 31,1%. Não depende de um punhado de meses fora da curva.
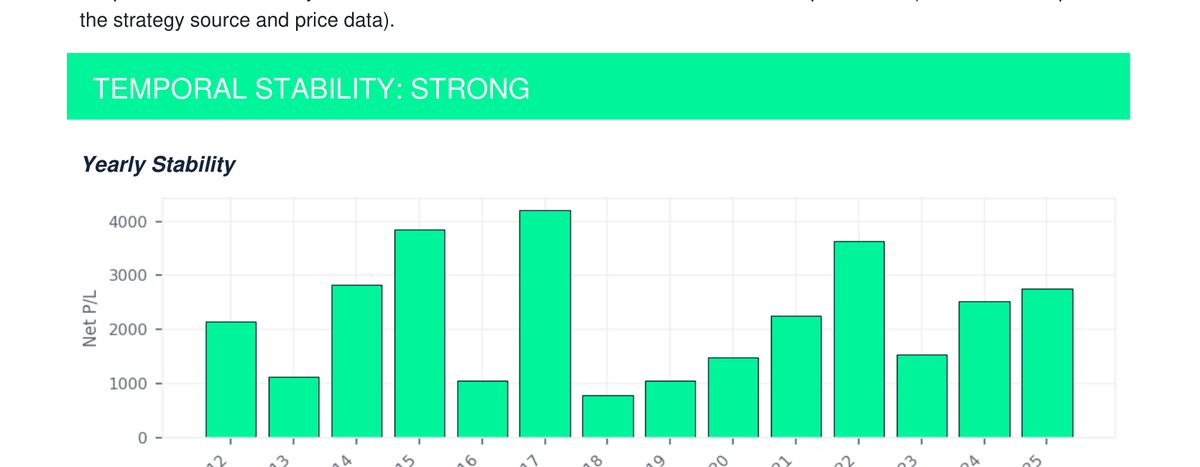
Net P&L per calendar year — 14 of 14 years profitable.P&L líquido por ano-calendário — 14 de 14 anos lucrativos.
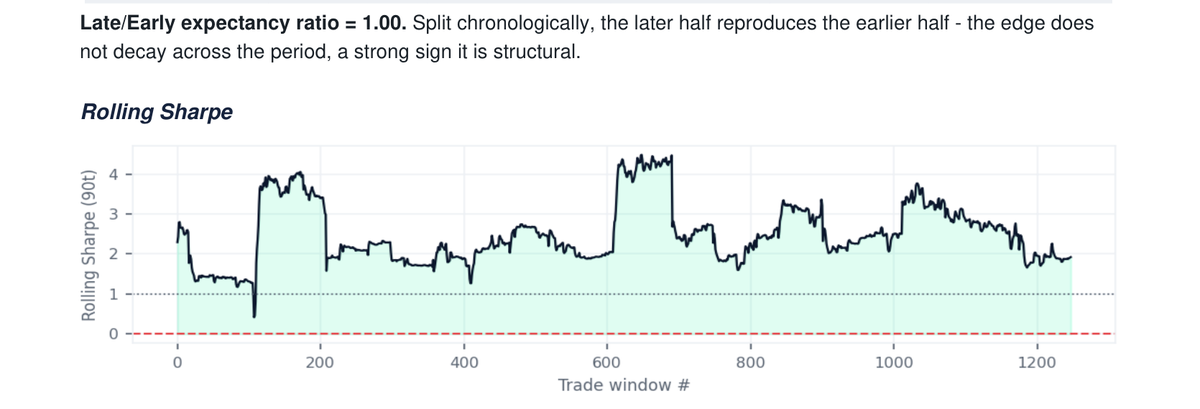
Risk-adjusted return over a moving 90-trade window. 0 of 1,248 windows negative.Retorno ajustado ao risco numa janela móvel de 90 trades. 0 de 1.248 janelas negativas.
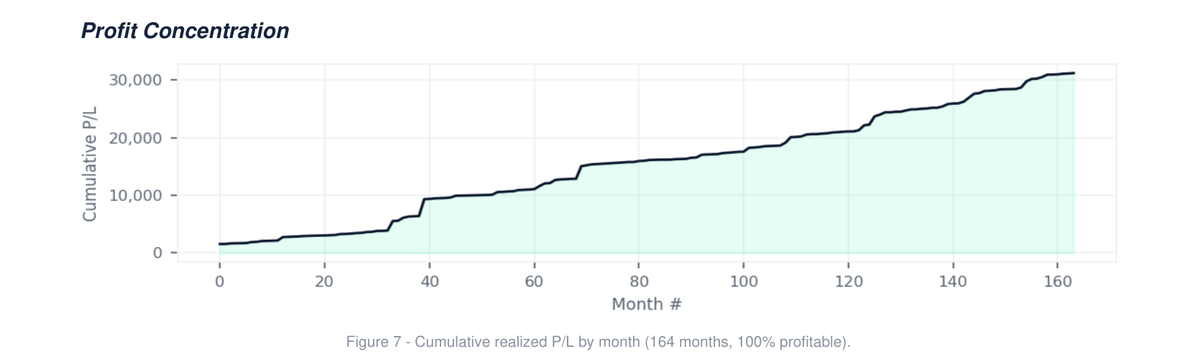
Cumulative realized P/L by month across 164 months — smooth, not dependent on outlier spikes.P/L realizado acumulado por mês ao longo de 164 meses — suave, não dependente de picos isolados.
Methodology NoteNota de Metodologia
Monte Carlo resampling tests robustness of the realized track record to trade ordering and selection. It does not simulate unseen market conditions and complements — not replaces — forward / walk-forward testing on live or out-of-sample data. This analysis pairs with, and does not substitute, the live MyFxBook track record linked in the footer below. A reamostragem Monte Carlo testa a robustez do track record realizado à ordenação e seleção de trades. Não simula condições de mercado inéditas e complementa — não substitui — o teste forward / walk-forward em dados live ou fora da amostra. Esta análise se soma, e não substitui, o track record live do MyFxBook linkado no rodapé abaixo.
Frequently Asked QuestionsPerguntas Frequentes
The dashboard isn't showing.
O painel não aparece.
Make sure Allow Algo Trading is enabled (toolbar button and in the EA's Common tab), and that the "UI" input controlling status display is set to true.
Confirme que Allow Algo Trading está ativado (botão da barra de ferramentas e na aba Common do EA), e que o input "UI" que controla a exibição do status está como true.
The AI Guardian section shows "Disabled".
A seção AI Guardian mostra "Disabled".
This is expected and normal for the flagship configuration — the core strategy runs without the AI risk supervisor and this does not affect the validated results.
Isso é esperado e normal na configuração flagship — a estratégia principal roda sem o supervisor de risco de IA e isso não afeta os resultados validados.
Can I run this on a different symbol or timeframe?
Posso rodar em outro par ou timeframe?
QuantumGrid Smart is validated specifically for EURUSD M15. Running on other instruments or timeframes is unsupported and results will not match the validated figures.
O QuantumGrid Smart é validado especificamente para EURUSD M15. Rodar em outros instrumentos ou timeframes não é suportado e os resultados não vão corresponder aos números validados.
Is the Robustness Analysis independently verified?
A Análise de Robustez é verificada de forma independente?
No — it's an internal analysis we run on our own products using our own auditing methodology (Monte Carlo resampling + temporal stability testing), and we label it as such. We publish it, caveats included, because we'd rather show you the full picture — including the equity drawdown risk inherent to grid systems — than hide behind a number that only tells part of the story. Independent verification is available on request.
Não — é uma análise interna que rodamos nos nossos próprios produtos usando nossa própria metodologia de auditoria (reamostragem Monte Carlo + teste de estabilidade temporal), e a rotulamos como tal. Publicamos, alertas inclusos, porque preferimos mostrar o quadro completo — incluindo o risco de drawdown de capital inerente a sistemas de grid — a esconder atrás de um número que só conta parte da história. Verificação independente está disponível sob consulta.
Ready to Start? Pronto para Começar?
Get QuantumGrid Smart with 50% Early Adopter discount or receive it for free via our IB partner program. Adquira o QuantumGrid Smart com 50% de desconto de lançamento ou receba gratuitamente pelo nosso programa IB.